Catch Cup Test Results
If you’ve ran a full Catch Cup Test, you’d likely end up on the page for the test results. I’ll explain what each of these settings means.
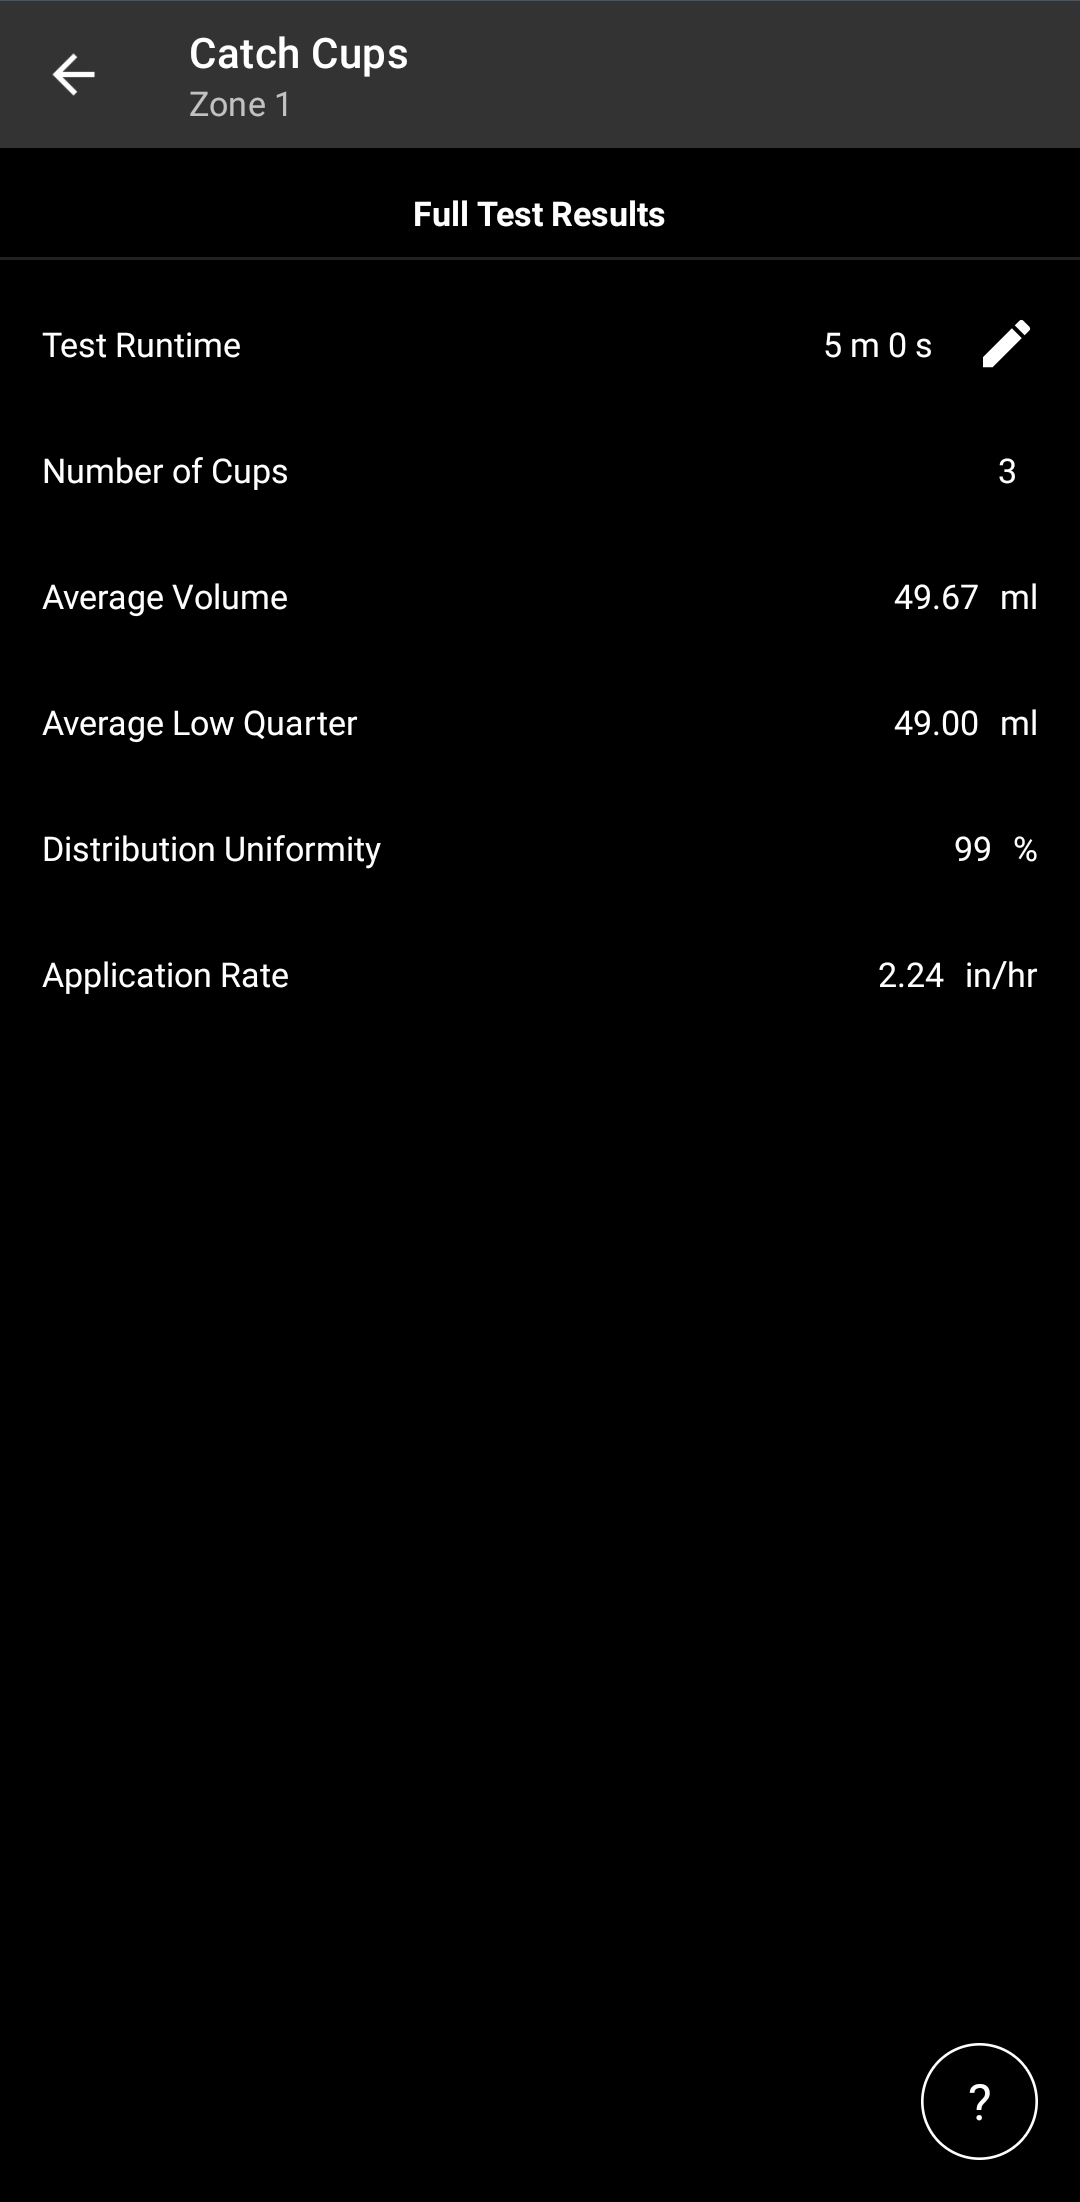
Test Runtime – The duration the test ran for. The default is 5 minutes, but this can be changed
Number of Cups – This is the amount of cups you put in on the results page.
Average Volume – The average amount of water each of your cups had
Distribution Uniformity – This a measure of how uniformly water is applied to the area being watered, expressed as a ratio. Anything above 80% is considered a well working zone. This is a measure of the average of the lowest quarter of samples, divided by the average of all samples.
Application Rate – This is how much water your sprinklers are putting down an hour, based off of the catch cup data.
Devices Covered: 57946 57950 57915 57925 57985 57995 04138 21205 24511 24632 24634
Back to Support pageTags: B-hyve, B-hyve App, Smart Watering